
Create a new Forecast
Simply click the “plus” icon next to “Forecasting” in the left-hand navigation menu.
Then complete the setup form. All types of analysis require a friendly name so you can identify this analysis later. Once essential fields are completed, the Save and Fit button becomes active.
| Field | Requirements |
|---|---|
| Name | A name for the analysis to help you find it again later. |
| Connection | An existing connection. To create and manage connections, see Creating and Managing Database Connections |
Only the first tab is required for a basic forecast - all other tabs offer customization and/or additional capabilities but are not required to get started.
Data Selection
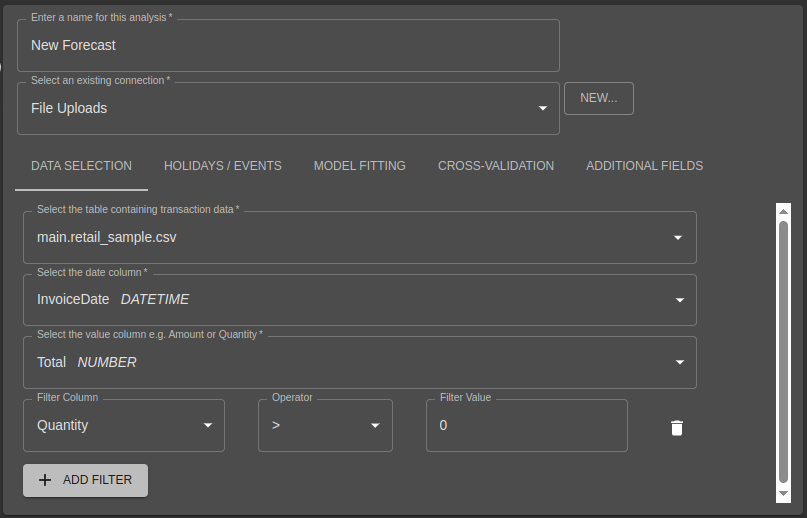
| Field | Requirements |
|---|---|
| Table | An existing table or view in your data source. |
| Date Column | This can be a date, datetime or timestamp typed field. In the case of uploaded data, ensure date or timestamps are formatted as ISO8601 values. Data is aggregated to hourly, daily or weekly level prior to forecasting future values based on the settings in “Model Fitting” below. The default is “Daily”. |
| Value | The value you wish to forecast. This should be a numeric type and could refer to a monetary amount, or a quantity. |
| Filters (Optional) | A filter comprises of a filter-column, an operator (=, , =) and a value. If multiple filters are added, they will be “and”ed together. |
There is no requirement to pre-summarise or aggregate data, therefore a sales-order, sales-invoice or transaction table with appropriate analysis data fields (see below) can be used directly.
Holidays / Events
To model standard and custom holidays and events, use the settings in this tab.
| Data element | Requirements |
|---|---|
| Holiday Calendar (Optional) | Select the national holidays applicable to your sales data. If you operate in multiple geographies each with different holiday calendars, it may be appropriate to split the data by geography and create a separate forecast for each. This value is an ISO-3166 code. This can be confusing, for example the United Kingdom is represented by “GB” and not “UK”. |
| Subdivision (Optional) | Some Holiday calendars have subdivisions, e.g. US States, Autralian Terrotiroes and so on. If you choose a holiday calendar, but not a subdivision, then only those public holidays common to all subdivisions will be included. Choosing a specific subdivision will include all holidays both in the country and the given subdivision. |
| Include Observed Holidays (Optional) | Some holidays “float” to the next weekday if they would otherwise occur on a weekend, for example Boxing Day. Ticking this box will fit parameters both for the original date and it’s amended date. |
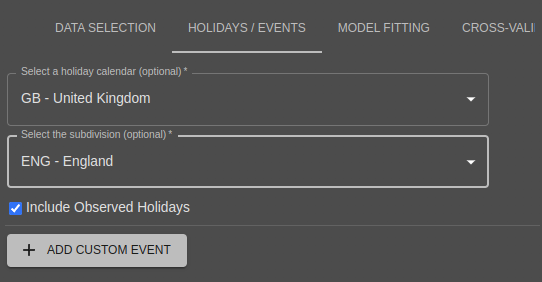
Custom Events
Each custom events required a name, plus a list of event dates and their durations. The example below shows Wimbledon dates:
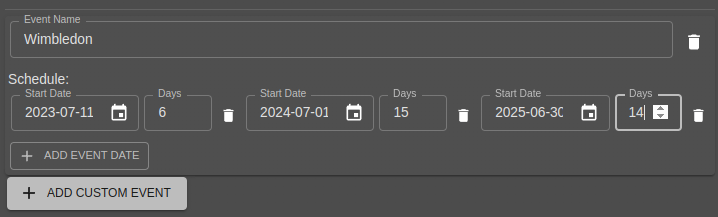
Ensure to enter historic and future occurance of the custom events to ensure accurate forecasts.
Model Fitting
| Parameter | Requirements |
|---|---|
| Frequency (Optional) | Hourly - Hourly data truncates the time part of a datetime/datestamp to the start of each hour. Daily (Default) - this will truncate the time off any timestamp/datetime value to leave just the date. No timezone conversion is performed, although if your data spans timezone boundaries it makes sense for your data source to always use UTC dates and times. Weekly - Weekly data is summarised using Monday as the first day of the week. |
| Model Type (Optional) | If you think the uplift in sales due to day of week or holidays provides a percentage uplift in sales, choose “Multiplicative”. If you think the uplift in sales due to day of week or holidays provides a fixed additional level of sales, choose “Additive”. |
| Advanced Tuning Parameters (Optional) | You may override the model settings for Changepoint Prior Scale, Seasonability Prior Scale, Holidays Prior Scale and/or Changepoint Data Range, however sensible defaults are provided. For more details on these parameters, see https://facebook.github.io/prophet/docs/diagnostics.html#hyperparameter-tuning in the prophet documentation. |
Cross-validation
During model fitting, many forecasts are created from ranges of historic data and the forecasts compared with known actuals. This helps to assess the likely model accuracy of making predictions into the future.
Regardless of whether the model frequency is hourly, daily or weekly, all of these parameters are specified in days.
The default values below would mean that;
- A “forecast window” is taken from the first 90 days of available data
- Predictions would be made 7 days into the future and compared to actuals
- The window is extended by an additional 14 days and the above two steps are repeated on the larger dataset This is repeated as many times as possible until there are no more actual value to compare forecasts to
| Parameter | Default value |
|---|---|
| Initial Period | 90 |
| Period for cross-validation | 14 |
| Horizon for cross-validation | 7 |
Additional Fields / Regressors
It’s possible to include the effects of other fields in the analysis which may influence forecasts.
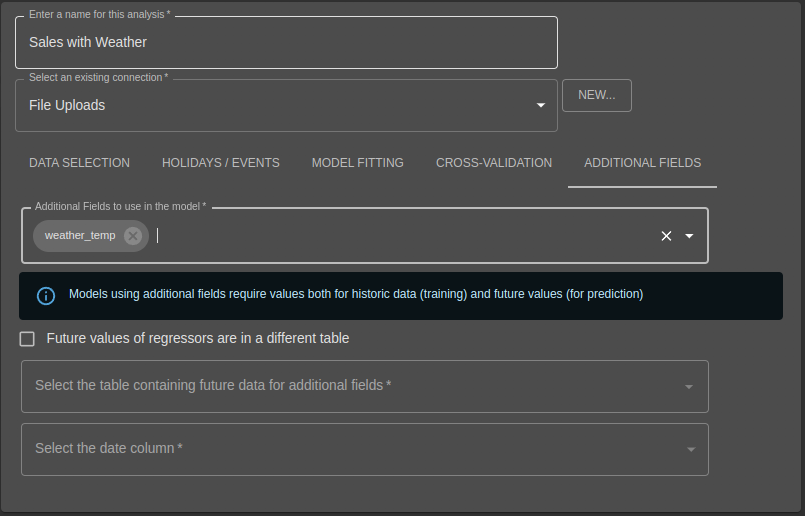
You must provide data for historic and future dates, although future values can be in a different table to the historic data. When requesting forecasts, only future dates with available values for additional fields will be included.
| Parameter | Requirements |
|---|---|
| Additional Fields (Optional) | One or more numeric fields. Data is standardized prior to model fitting, so the units/scale do not matter |
| Future Values of Regressors are in a different table (Optional) | Tick the box if future values of the additional fields are in a different table to the source data |
| Table for Future Values (Optional) | If ticking the box above, provide an alternative table name |
| Date Column for Future Values (Optional) | If ticking the box above, provide an alternative date column. |
Create the analysis
Once all fields are completed, you will see a preview of the data that you can use to sanity check that the correct fields are chosen. Then click “Save and Fit” and choose a model infrastructure type to continue.
Fitting
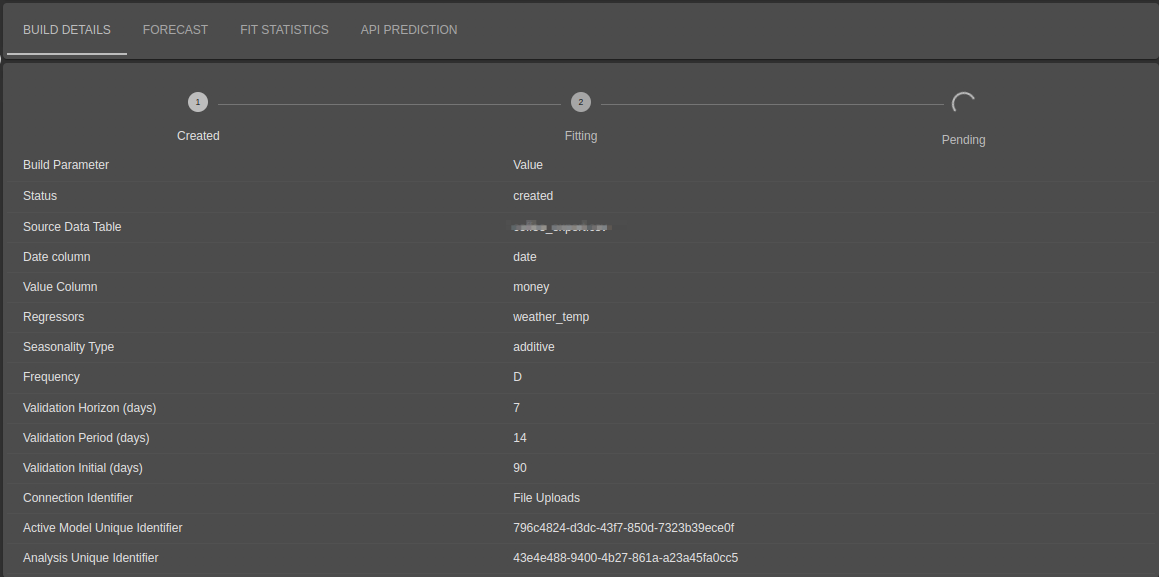
After clicking “Save and Fit”, infrastructure will be created and queries are issued to your data source. A summary of the analysis is displayed along with its status.
It may take a few seconds, a few minutes, or even a few hours, depending on data size to fit (or build) the model that provides the analysis.
The page will refresh automatically as the status moves from Created, to Fitting, to Fitted.
You may navigate away from this tab, or the whole application, without interrupting the build.
View and export the forecast values
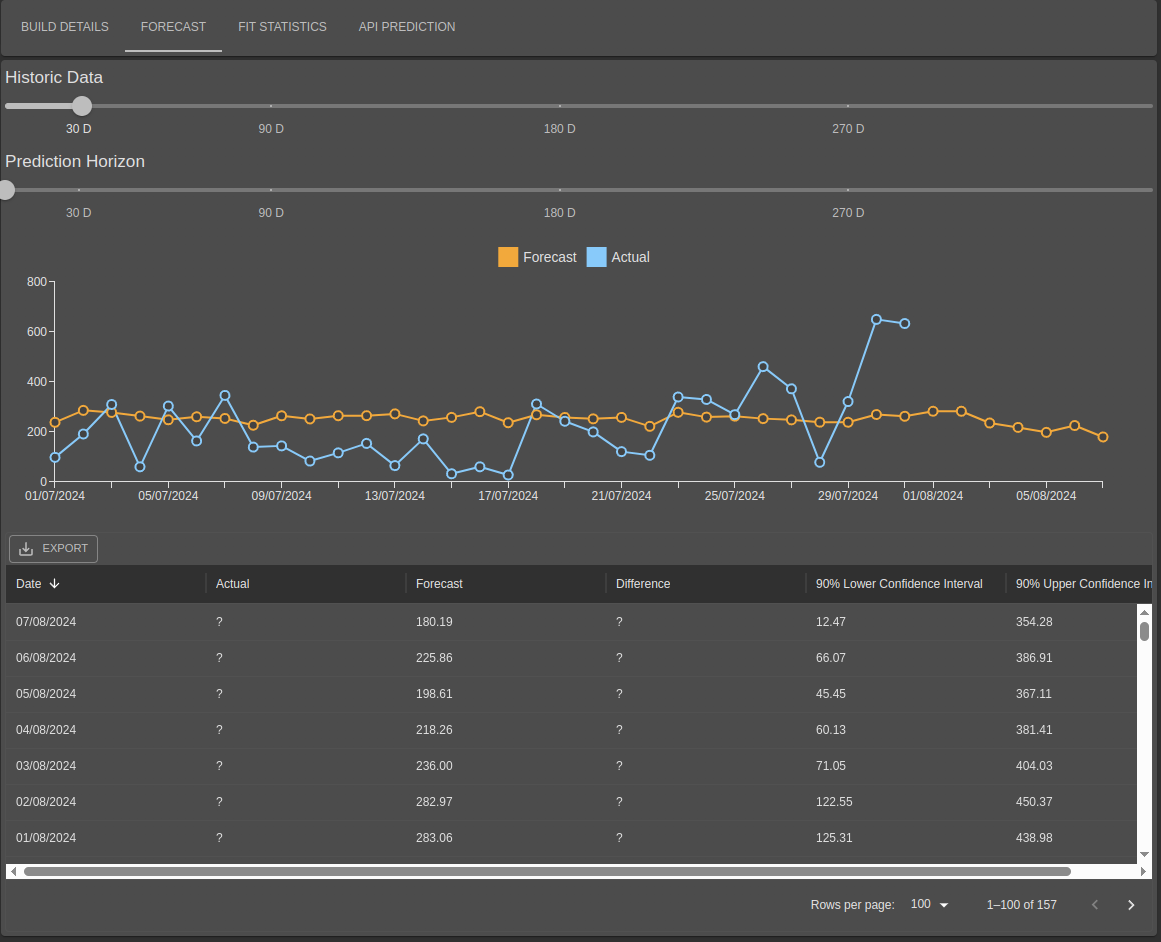
The “Forecast” tab shows a chart a table of actual and forecasted values.
The number of days of history, as well as the forecast horizon (days into the future) displayed can be adjusted using the sliders.
The data can be exported in CSV format using the “Export“ button. To export back to the source database, create a workflow and use the “Export Forecasts” task.
Assess the quality of the forecasting model
Crossvalidation
The likely performance of a forecasting model is assessed using _crossvalidation, _a method by which many forecasts are re-fit on a sliding window of available data and comparing the predictions to the actuals. See the section earlier on crossvalidation parameters to understand more detail on how this works.
Forecasts are prepared using the prophet library - more details on the methodology for forecasts and crossvalidation can be found on their documentation page
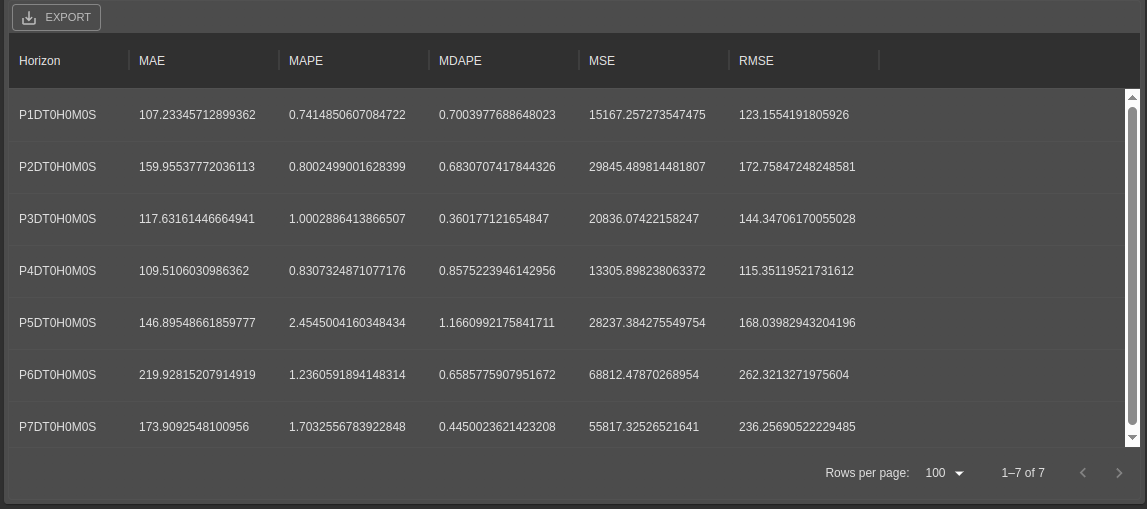
The columns in the cross-validation tab contain statistics split by the horizon - how far into the future you are looking.
| Column | Description |
|---|---|
| Horizon | The number of days into the future you want to look. Performance (difference between forecasted values and actual values) is likely to worsen as the horizon increases. |
| MAE | The Mean Absolute Error - the average difference between the forecast and actual values |
| MDAPE | The Median Absolute Percentage Error |
| MSE | The Mean Square Error |
| RMSE | The (Squre) Root Mean Square Error |
| SMAPE | The Symmetric Mean Absolute Percentage Error |
| MAPE | The Mean Absolute Percentage Error. If some estimates are close to zero, this number is not provided. |
Additional Variables
If you included additional variables in the model, the regressor coefficients are provided:

The coefficient in this example suggests that for each additional unit of weather_temp, the forecasted value will increase by 29.3 (on average).
Re-fit the model on the latest available data
The data available via the configured data source may be constantly changing as new transactions are recorded. You may re-fit/re-build the underlying model for a given analysis without having to fill out all of the information again. Simple click the “Re-fit on latest data” icon next to the drop-down list of available builds.

You may also set the Active model or delete a particular build. For more information on what the active model refers to, see Manage Existing Analysis Models .