
Create a new Customer Clusters analysis
Simply click the “plus” icon next to “Customer Clusters” in the left-hand naviation menu or click “Create a new customer cluster analysis” from the welcome screen.
Then complete the simple form.
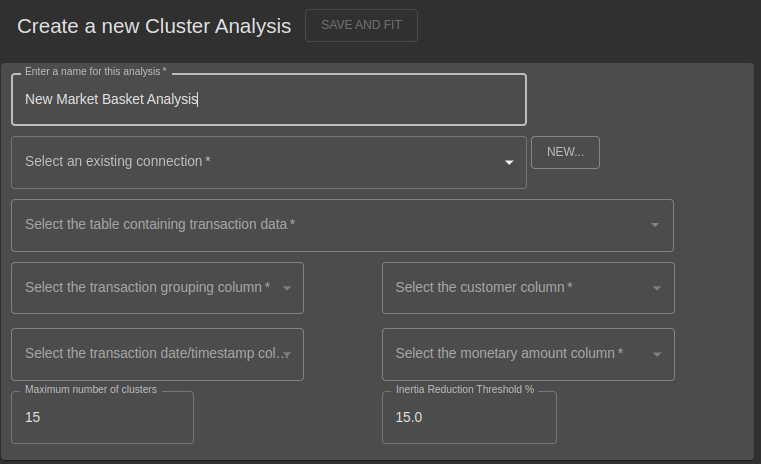
Identify your data source
| Field | Requirements |
|---|---|
| Connection | An existing connection. To create and manage connections, see Creating and Managing Database Connections |
| Table | An existing table or view in your data source. |
The input data is automatically transformed to create a Recency, Frequency and Monetary value for each distinct customer. These describe 3 important differentiating characteristics of your customers.
Choose analysis data fields
Market Basket analysis requires only two key pieces of data in your data source.
| Data element | Requirements |
|---|---|
| Customer Identifier | This field is used to group the input data prior to analysis. For some data sources, this may be a loyalty card or membership number. |
| Transaction Grouping | Typically this will be an Invoice or Order number, basket identifier or other such field that groups multiple line-items into a single logical transaction. This number of distinct values per customer is used as the Frequency in the analysis. |
| Date/Timestamp | This days between the maximum value of this column to the date the analysis is built is used as the Recency in the analysis. |
| Monetary Amount | The lifetime value is obtain by totalling these values and is used as the Monetary in the analysis. If your customer transact in multiple currencies, it is recommended to split the data by geography and analysis each group of customer separately. |
Provide model input parameters
Parameters for Customer Clusters control how clusters are formed. The data is treated as one large customer group/cluster in order to measure a baseline inertia (a measure of how disbursed or separately from each other customers are). It is then iteratively divided into more groups until (i) the maximum number of clusters are reached or (ii) the drop in inertial since the last split is below a certain percentage.
This sounds complicated, but the default are sensible and you can assess the customer groups afterwards to visually inspect how well separated the groups are based on their purchasing habits.
| Parameter | Requirements |
|---|---|
| Maximum Clusters | The maximum possible number of groups to split customers between. Although the clusters are formed using only Recency, Frequency and Monetary values, each of those could be clumped into several groups. |
| Inertia Reduction Threshold | A new cluster is added, data is re-aligned to it’s closest cluster and the inertial re-calculated. If it hasn’t changed much, then adding a new group hasn’t really separated customers in any meaningful way and we stop and retain the previous number of groups/clusters as the final number. |
After post-processing the data, analysis is performed using the k-means algorithm, using the sklearn library
Choose a build infrastructure
See Build Infrastructure for details on the infrastructure provisioned for building the analysis.
Create the analysis
Once all fields are completed, you will see a preview of the data that you can use to sanity check that the correct fields are chosen. Then click “Save and Fit” to continue.
Fitting
After clicking “Save and Fit”, selected the infrastructure to deploy to build the underlying model. A summary of the analysis is displayed along with its status.
It may take a few seconds, a few minutes, or even a few hours, depending on data size to fit (or build) the model that provides the analysis.
The page will refresh automatically as the status moves from Created, to Fitting, to Fitted.
You may navigate away from this tab, or the whole application, without interrupting the build.
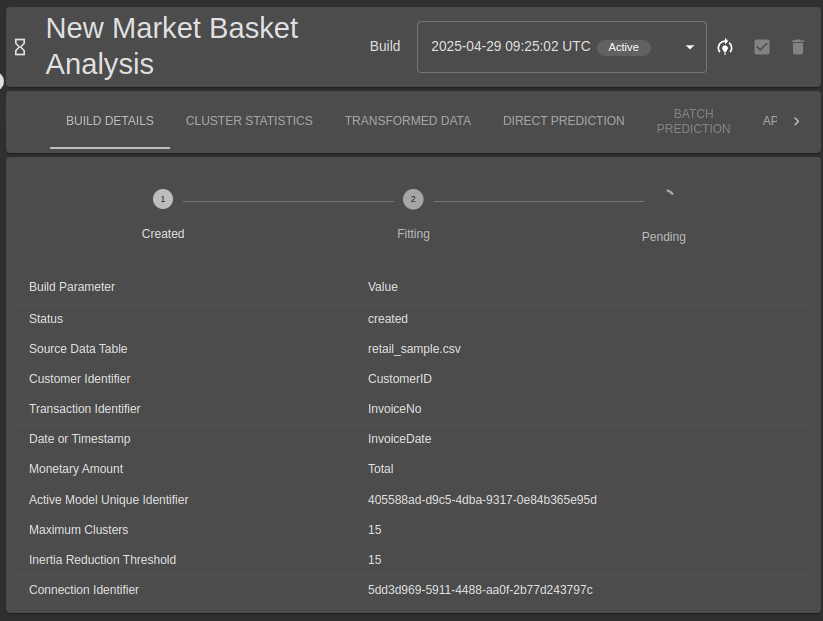
Assess the Cluster Quality
The “Cluster Statistics” tab will become available once a model has been fitted (built).
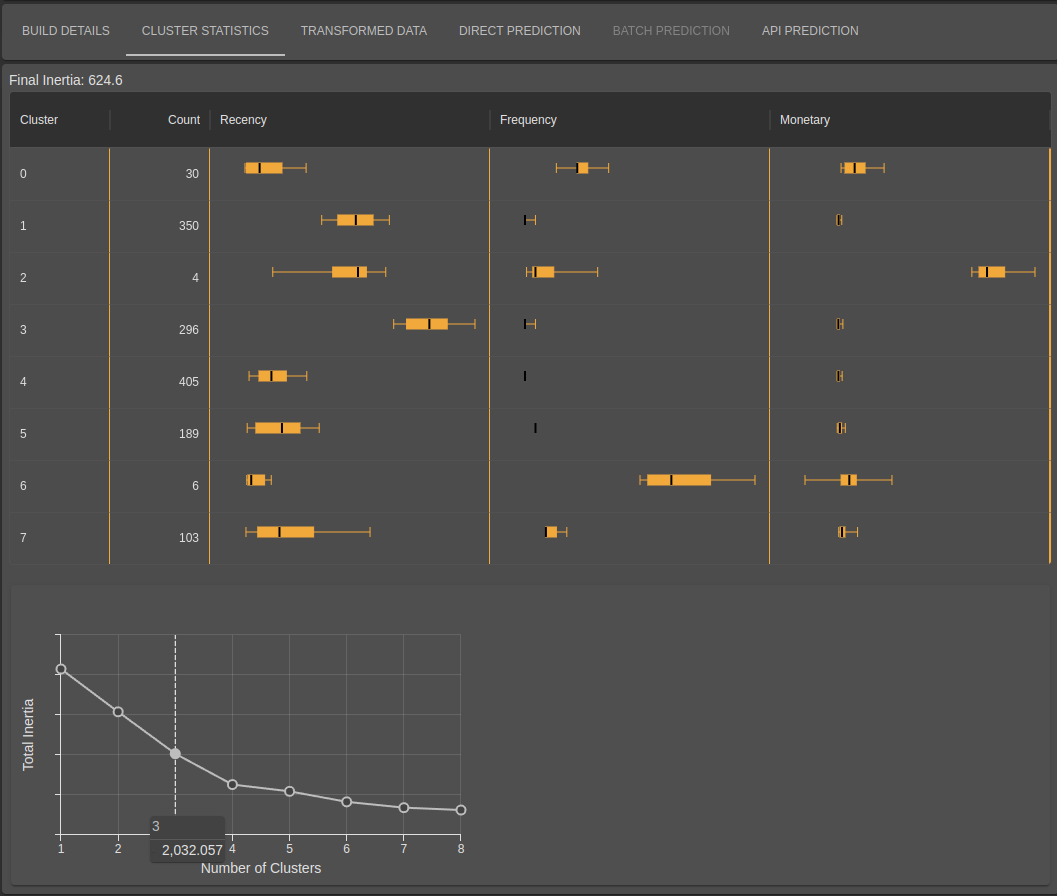
The columns of the table show
| Column | Description |
|---|---|
| Cluster | A cluster ID starting at 0. |
| Count | The number of customer in each cluster. Sometimes clusters are formed with a single or very few customers - these are typically outliers rather than a genuine cluster. Be cautious targetting the customers in such clusters. |
| Recency | A box-and-whisker plot for each metric. The whiskers are at the 5th and 95th percentile, the box is between the 25th and 75th and the median as also shown as a dark line within the box. Good results would have non-overlapping box-and-whisker plots for at least one of Recency, Frequency or Monetary for each Cluster. |
| Frequency | |
| Monetary |
The Chart shows the dropping inertia as more clusters are added. It should drop quickly then start to level off.
Once reviewing this chart, you may choose to re-run the model with a smaller number of maximum clusters. There is no right answer other than having groups of customers that are different enough in their behaviour to be treated differently in campaigns/promotions/retention strategies.
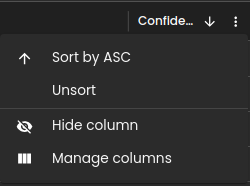
You may change the sort field or add/remove displayed columns by clicking the column header menu:
Re-fit the model on the latest available data
The data available via the configured data source may be constantly changing as new transactions are recorded. You may re-fit/re-build the underlying model for a given analysis without having to fill out all of the information again. Simple click the “Re-fit on latest data”  icon next to the drop-down list of available builds.

You may also set the Active model or delete a particular build. For more information on what the active model refers to, see Manage Existing Analysis Models .
Make predictions
The Direct Prediction tab allows you to enter the Recency, Frequency or Monetary values for a customer and see which group/cluster they would belong to.
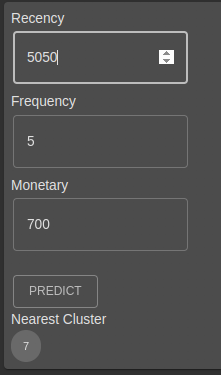
Direct Prediction is backed by a highly-available, performant API you can use in your ERP, CRM or other systems to make suggestions in real-time as customer records are used.
The API Prediction tab shows the API call equivalent to the items in the Online Prediction tab. See Using the API for more details on making automated predictions.
If you need help integrating predictions into another system, contact your support representative for assistance
Batch prediction exports the customer identifier and cluster ID back to the source database.